
Writing a Bézier Curve Plotter
Bézier curves are a rather nice looking model of parametric curves, and while they undoubtedly have many practical uses, I mainly just like the look of them (especially when visualising the construction process), so what I’ll be writing is an almost screensaver-like program that randomly generates bézier curves, and draws them over a period of time, until it finishes and moves onto drawing the next random curve.
Note: I will be using Python, with the Pygame library for 2D visuals, but all of the code can be generalised to any language and graphics library.
Despite coming from a relatively heavy area of maths, the wikipedia page for bézier curves gives a surprisingly intuitive idea of how they are constructed, and was actually the inspiration for writing this program.
I won’t go into any of the maths here (probably because I don’t actually know any of it), but instead show my solution to the problem. (Before continuing, please do look at the Wikipedia page, since I won’t be going into detail about what bézier curves actually are).
The Model
To construct the curve, we first need an ordered list of ‘construction’ points (I’m making up notation as I go along, bear with me). These points will be completely stationary as the curve is constructed.

Construction points
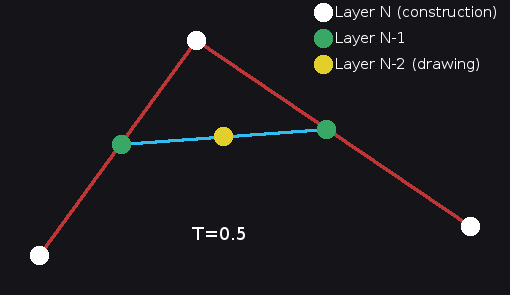
For this example, lets use 3 construction points. Each adjacent pair of construction points defines a line segment (shown by the red lines in the diagram). This pair of ‘parent’ points creates a ‘child’ point, that, during the construction of the curve, moves along the line, from one of the parents to the other. In mathematical terms the ‘child’ point linearly interpolates between the two ‘parent’ points on the interval [0, 1].
Linearly interpolating between two points
Again, the Wikipedia article does a very nice job of showing this.
If we do this for each adjacent pair of construction points, we end up with another ‘layer’ of points (if the construction points is imagined as the first ‘layer’). If the construction layer has N points, the layer below contains N-1 points.
This is all fine and good by itself, but what happens if we do it again? why not repeat the process of interpolating a ‘child’ point between two ‘parent’ points for this layer as well?
It turns out that even though the ‘parents’ may not be stationary, we can still interpolate between them for whatever position they are in at that point in time, irrespective of where they were previously.
Quadratic bézier curve (2nd order)
When we hit a layer with only 1 point however, we have to stop. While this lone point may seem like a bit of a party pooper, it is actually the one thing we were trying to find in the first place.
As the curve moves through the [0, 1] interval, the path of this point is what actually shows us the bézier curve, and so I call it the ‘drawing’ point.
At each of our discrete time-steps, the positions of the points are calculated from the top ‘construction’ layer downwards, as each layer is dependent on the layer above. The position of the drawing point, once calculated for that time-step, is added to a list containing all of the previous positions of the drawing point at their respective time-steps. Once t = 1, and all of the child points have fully moved from one parent to the next, all of the points in the list of previous drawing point positions can be connected up, one to the next to form an approximation of the bézier curve.
Layer hierarchy
Implementation
I’m going to be writing the source in an almost pseudo-code sort of way, to get the general idea of how it works without having to write all of the boilerplate and glue code.
First we need a way to linearly interpolate between two points based on a parameter t.
def lerp(p0, p1, t):
  # Get differences in x and y between the two points
  xDiff = p1.x - p0.x
  yDiff = p1.y - p0.y
  # Get the difference scaled by t to find the offset
  xOffset = xDiff * t
  yOffset = yDiff * t
  return Point(p0.x + xOffset, p0.y + yOffset)
(We call it ‘lerp’ because it is linear interpolation)
After this, it’s a simple matter of creating a list of top layer ‘construction’ points, assigning each adjacent pair a child point, then repeating for each subsequent layer until reaching the ‘drawing’ point. This can be easily generalised to any starting size (otherwise known as the ‘order’ of the curve).
def lerpAllLayers(layers, t):
  # Iterate over layers (excluding construction layer)
  for layerIndex in range(1, len(layers) - 1):
    # Iterate over points in layer
    for pointIndex in range(len(layer)):
      # Get first parent
      parent0 = layers[layerIndex - 1][pointIndex]
      # Get second parent
      parent1 = layers[layerIndex - 1][pointIndex + 1]
      # Assign child their new position
      layers[layerIndex][pointIndex] = lerp(parent0, parent1, t)
(Fun fact, python lists are mutable out of scope so don’t have to be passed back out of the function, be careful of this though!)
To get the drawing point’s history of positions, at each time-step it’s resultant position is added to a list.
And finally, here is the main loop. I’ve omitted all of the graphics code because it’s not too relevant.
INTERVAL = 0.05
STEPS = int(1 / INTERVAL)
curvePoints = list()
for t in range(STEPS):
  lerpAllLayers(layers, t)
  # Index of the drawing point
  curvePoints.append(layers[-1][0])
Drawing the curve can either be done at the very end, after all of the computation, which would give a static image, or in parallel with the computation, so you would see it drawn over time. If you did this you would have to include some sort of sleep call, otherwise you wouldn’t be able to see the process of the curve being drawn as it would happen so fast.

2nd order curve
4th order curve
Extras
- The other lines that you can see in the gifs are connecting the layers above the drawing point, with the static white lines being the top layer construction layer. They were drawn by traversing each layer and connecting adjacent points with lines. I think it makes it look very cool.
- Here is a github repo of my version of this. Keep in mind that I wrote this a good while ago, and so it’s pretty bad in places (i.e. all of it). Do not take any of the practices used in it, please.
- Here is another bézier curve plotter, except using the Unity3D Engine. This I made much more recently, so it might be good to look at.

Unity3D bézier curve, without rendering construction lines
Here's an interactive example!
- If bézier curves interest you, cubic splines are a very similar alternative, the main difference being that the curve defined by a cubic spline passes through all of it’s control points, whereas in a bézier curve, the control points act as more of a guide, or an attractive force pulling the curve towards it. They don’t necessarily have to pass through those points. In real world applications, cubic splines tend to be more useful than bézier curves, but require quite a bit more maths.
- Bézier curves can be created in any dimension you wish, above in the Unity version I made it’s in 3D, but if somebody somehow made a 4D or even higher dimension implementation that would be awesome.
And that is all! I hope some of that was useful, and I would recommend attempting to implement it if you have the time.